Astral Toolbox · Extension

Server Monitoring — metrics, SSH alerts, snapshots

A lightweight, cron-driven monitoring stack: 30 days of CPU, load, disk and Apache metrics with threshold alerting, live SSH-login tracking, and post-mortem snapshots captured automatically when an alert fires.

Live metrics, no daemon

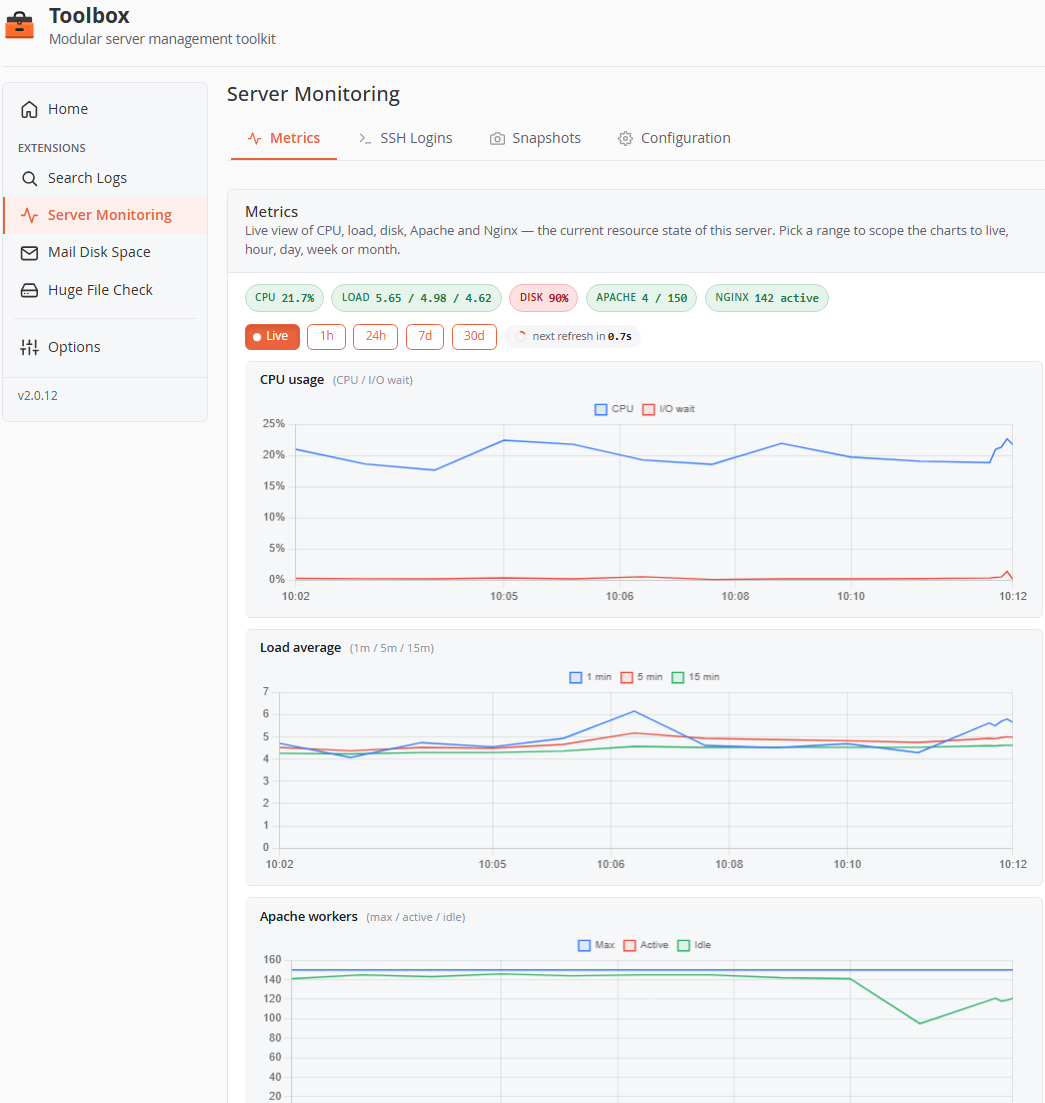
One-minute samples of the numbers that matter, charted with your alert thresholds drawn right on the graphs. Pick a range from the last 10 minutes to 30 days.

  • CPU and I/O wait, load average, disk per mount, Apache workers, Nginx connections
  • Ranges: Live (auto-refresh), 1h, 24h, 7d, 30d
  • Threshold + duration + cooldown alerting, emailed with a recovery notice
  • Load thresholds are per-core, so one config works across every server
Live metrics, no daemon
Server Monitoring · metrics

Know every SSH login

Each successful SSH authentication from /var/log/secure is recorded, grouped by source IP, and classified by risk — with an optional email on every login.

  • Grouped by source IP with reverse-DNS, last login and a 30-day frequency bar
  • Risk badges: New IP, Trusted, Known, Excluded
  • New IPs surfaced in a banner with a shortcut to the exclude list
  • Every login is kept in the audit trail even when its email is suppressed
Know every SSH login
Server Monitoring · SSH logins

Post-mortem snapshots

When an alert fires, Server Monitoring captures a wide cross-section of system state automatically — so you can investigate even if the server later goes down.

  • ~29 sections across system, processes, network, Apache, Nginx, MySQL, logs and cPanel
  • Fires automatically on alert, or on demand
  • View in-browser, download as a ZIP, or delete
  • Each section is sandboxed with a 60-second timeout — one failure never spoils the rest
Post-mortem snapshots
Server Monitoring · snapshots

Server Monitoring — questions

No. It's entirely cron-driven — a one-minute poll collects metrics and tails SSH logins, and a daily job prunes history. There's nothing resident to crash or leak.

An alert fires when a metric stays above its threshold for a whole duration window, and recovers when it drops back. CPU, I/O wait, load (1/5/15 min, per core), disk per mount, and Apache workers are all configurable; emails respect a per-metric cooldown.

Yes — it's the one Toolbox extension that's genuinely useful on DNSOnly nodes, for metrics and SSH-login tracking.

In a local SQLite database (metrics for 30 days, SSH logins for 45), plus snapshot ZIPs — all root-only on the server. Nothing is sent off the box.

See trouble before your clients do

Enable Server Monitoring and a free trial starts on its own — no key, no credit card.